hel-aqi-widget-win
A Rainmeter desktop widget that displays real-time AQI with 24-hour graphs for two locations.

If you follow the news from Armenia, you probably know how bad the air quality in Yerevan gets during the winter heating season — and this year it broke all records.
So I built a small desktop widget for Windows to keep air quality visible at all times.
The UI is built with Rainmeter, while a Python script fetches data from nearby Sensor.Community air quality sensors (within ~1 km), calculates AQI (PM2.5 / PM10), and renders graphs.
Data updates every 5 minutes.
The widget shows:
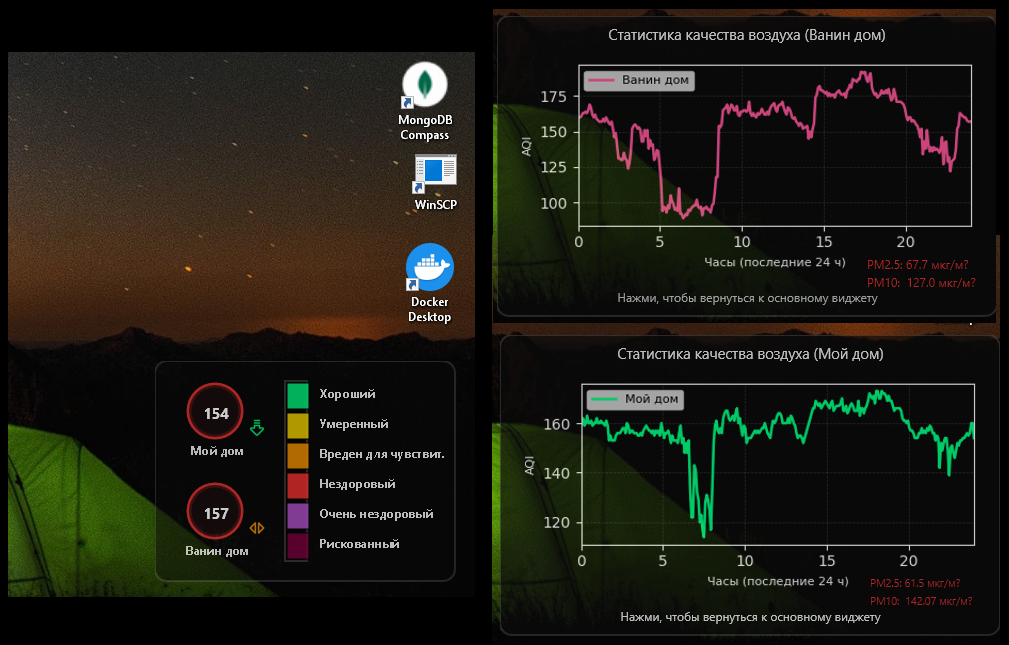
- real-time AQI for two locations
- color-coded pollution levels (Good → Hazardous)
- trend arrows (up / down / stable)
- 24-hour history graphs
- current PM2.5 / PM10 values
Clicking on the circles opens detailed graphs with daily history and current readings.
The arrows (drawn by me ^^) indicate trend direction, and the colors reflect pollution severity.
Rainmeter allows full control over behavior — snapping to screen edges, transparency, layering, and click-through mode.
Built mostly for myself, but turned out to be a really nice everyday tool.
Keep your desktop fresh and informed with a sleek widget that serves up live air quality info for two spots, complete with colorful scales and handy 24-hour trend graphs—because breathing easy is the ultimate flex!
Key features:
- 🌈 Color-coded AQI scale with clear labels
- 📈 Separate 24-hour AQI history graphs for two locations
- 🔄 Live updates every 5 minutes via a hidden Python-powered daemon
- 🖥️ Semi-transparent Rainmeter skin that snaps anywhere on your screen
This summary was generated by GitHub Copilot based on the project README.