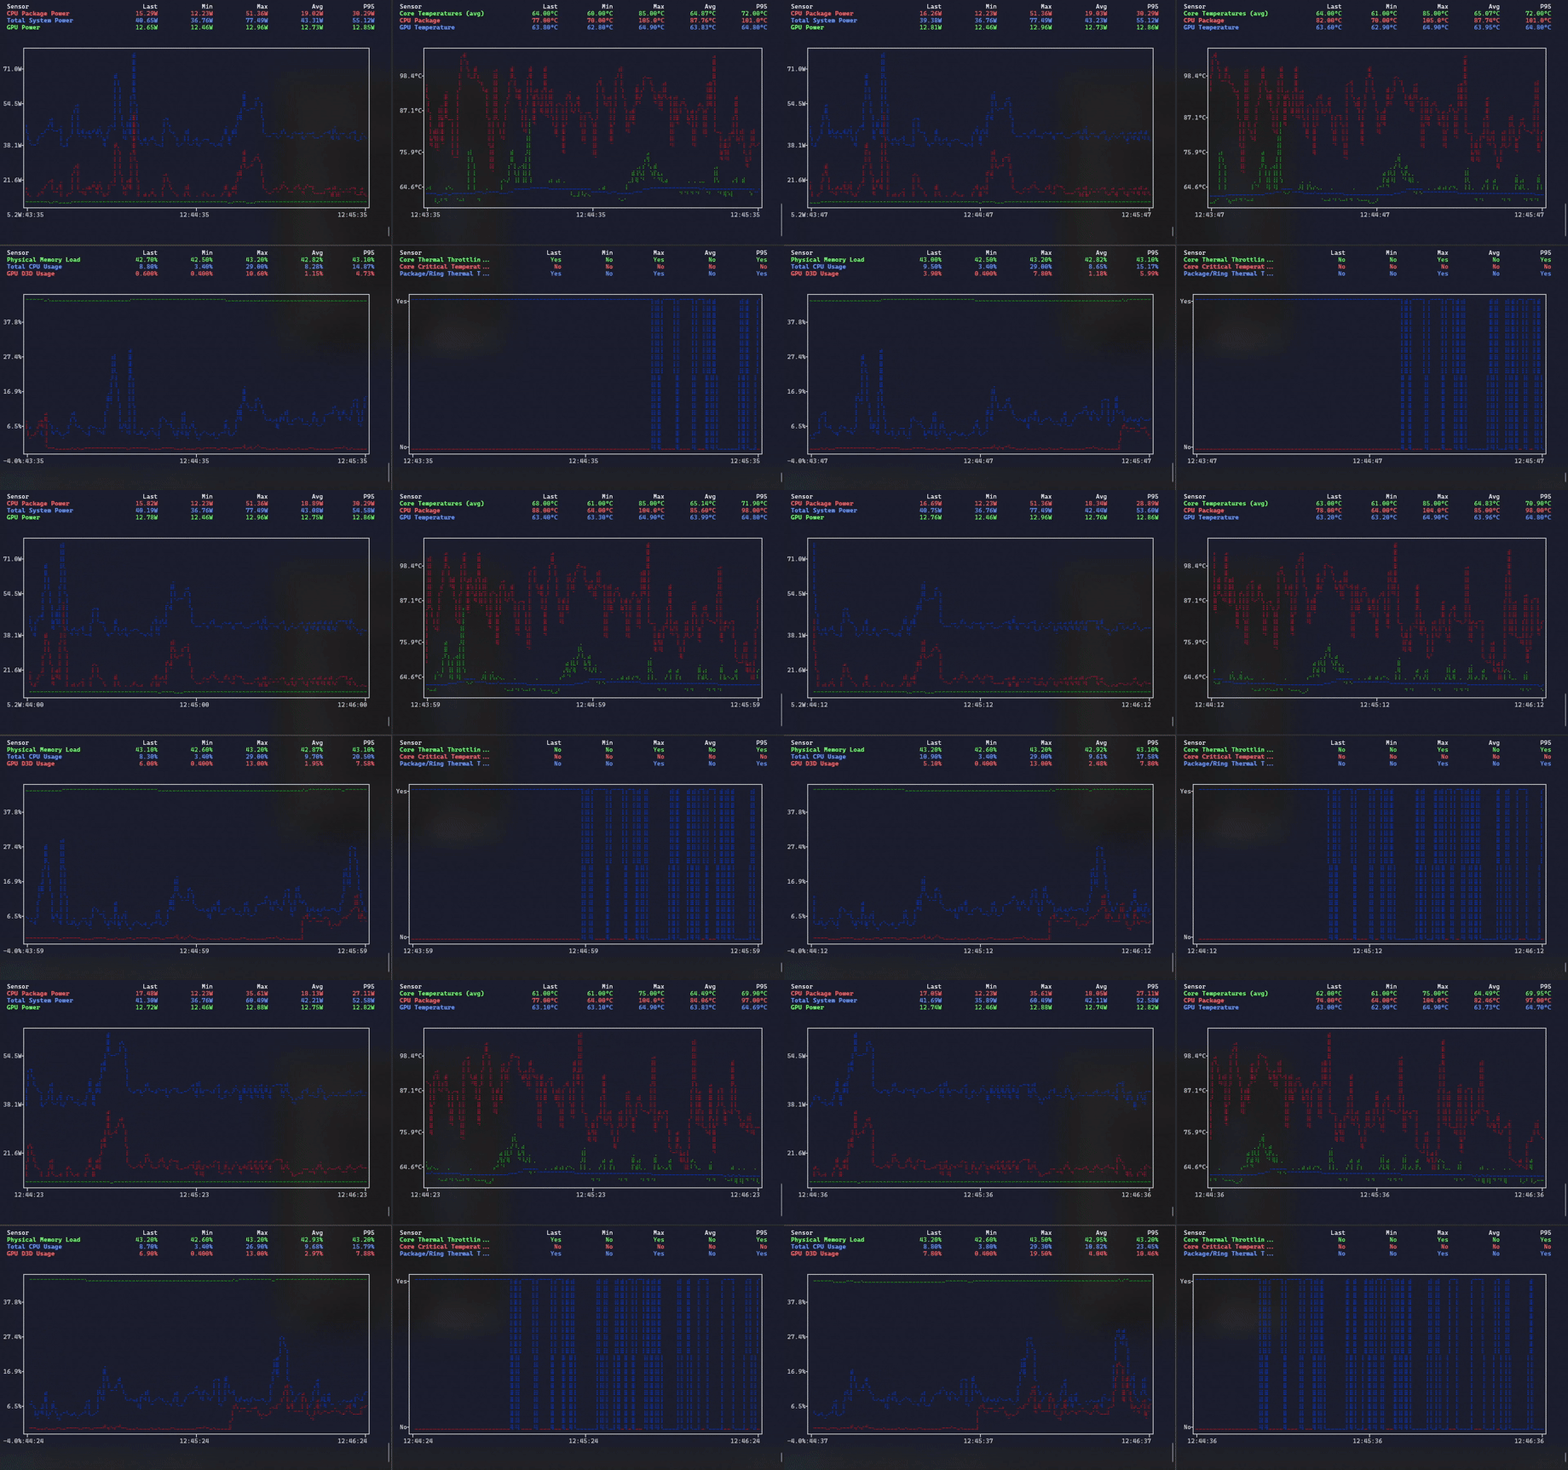
HWInfo-TUI is a terminal plotting tool for visualizing real-time hardware sensor data from HWInfo64, inspired by gping. I built it because I wanted a lightweight, always-visible way to monitor thermals, fan speeds, and other sensors without leaving the terminal.
It features real-time ASCII charts with dual Y-axes for different units, fuzzy sensor matching so you don’t need exact names, and rich statistics. Fits perfectly in a multi-pane terminal dashboard alongside tools like btm and gping. Available via pip and WinGet.
Like gping but for your hardware sensors — watch your CPU temps, GPU power, and system load dance across beautiful terminal charts in real-time, all fed from HWInfo64's CSV logging.
Key features:
- 📊 Real-time plots with min/max/average/95th percentile statistics
- 📈 Dual Y-axes support for mixing units like temps and percentages
- 🔍 Fuzzy sensor name matching so you dont need exact names
- 🖥️ Responsive design auto-adapts to terminal size with compact mode
This summary was generated by GitHub Copilot based on the project README.